IO
Interaction Design / Creative Coding / Machine Learning
Collections, space and the creative flow
Collections are everywhere. Think of books, clothes, memories. Our intention with them is to reorganise, filter, shape order from chaos. I like to think of the act of collecting as the act of curating.
Sometimes it is really hard to find and compare relevant pieces, such as when searching for books in corridors of a library, or browsing through hundreds of images in a folder. In general, searching is a very crucial act in the sea of information, many tech companies are exist only because of this fact.
Machine Learning can help find correlations within collections, that would be hard to trace otherwise. Similarities of items can be compared along different type of features that are measurable. Pixels, shapes of images, spectral components of sounds, lexical structure of text are all quantitative contents of (media) datasets. Sometimes I use these properties at the beginning of a creative workflow, at the state when I have to collect inspirations and raw material for a work.
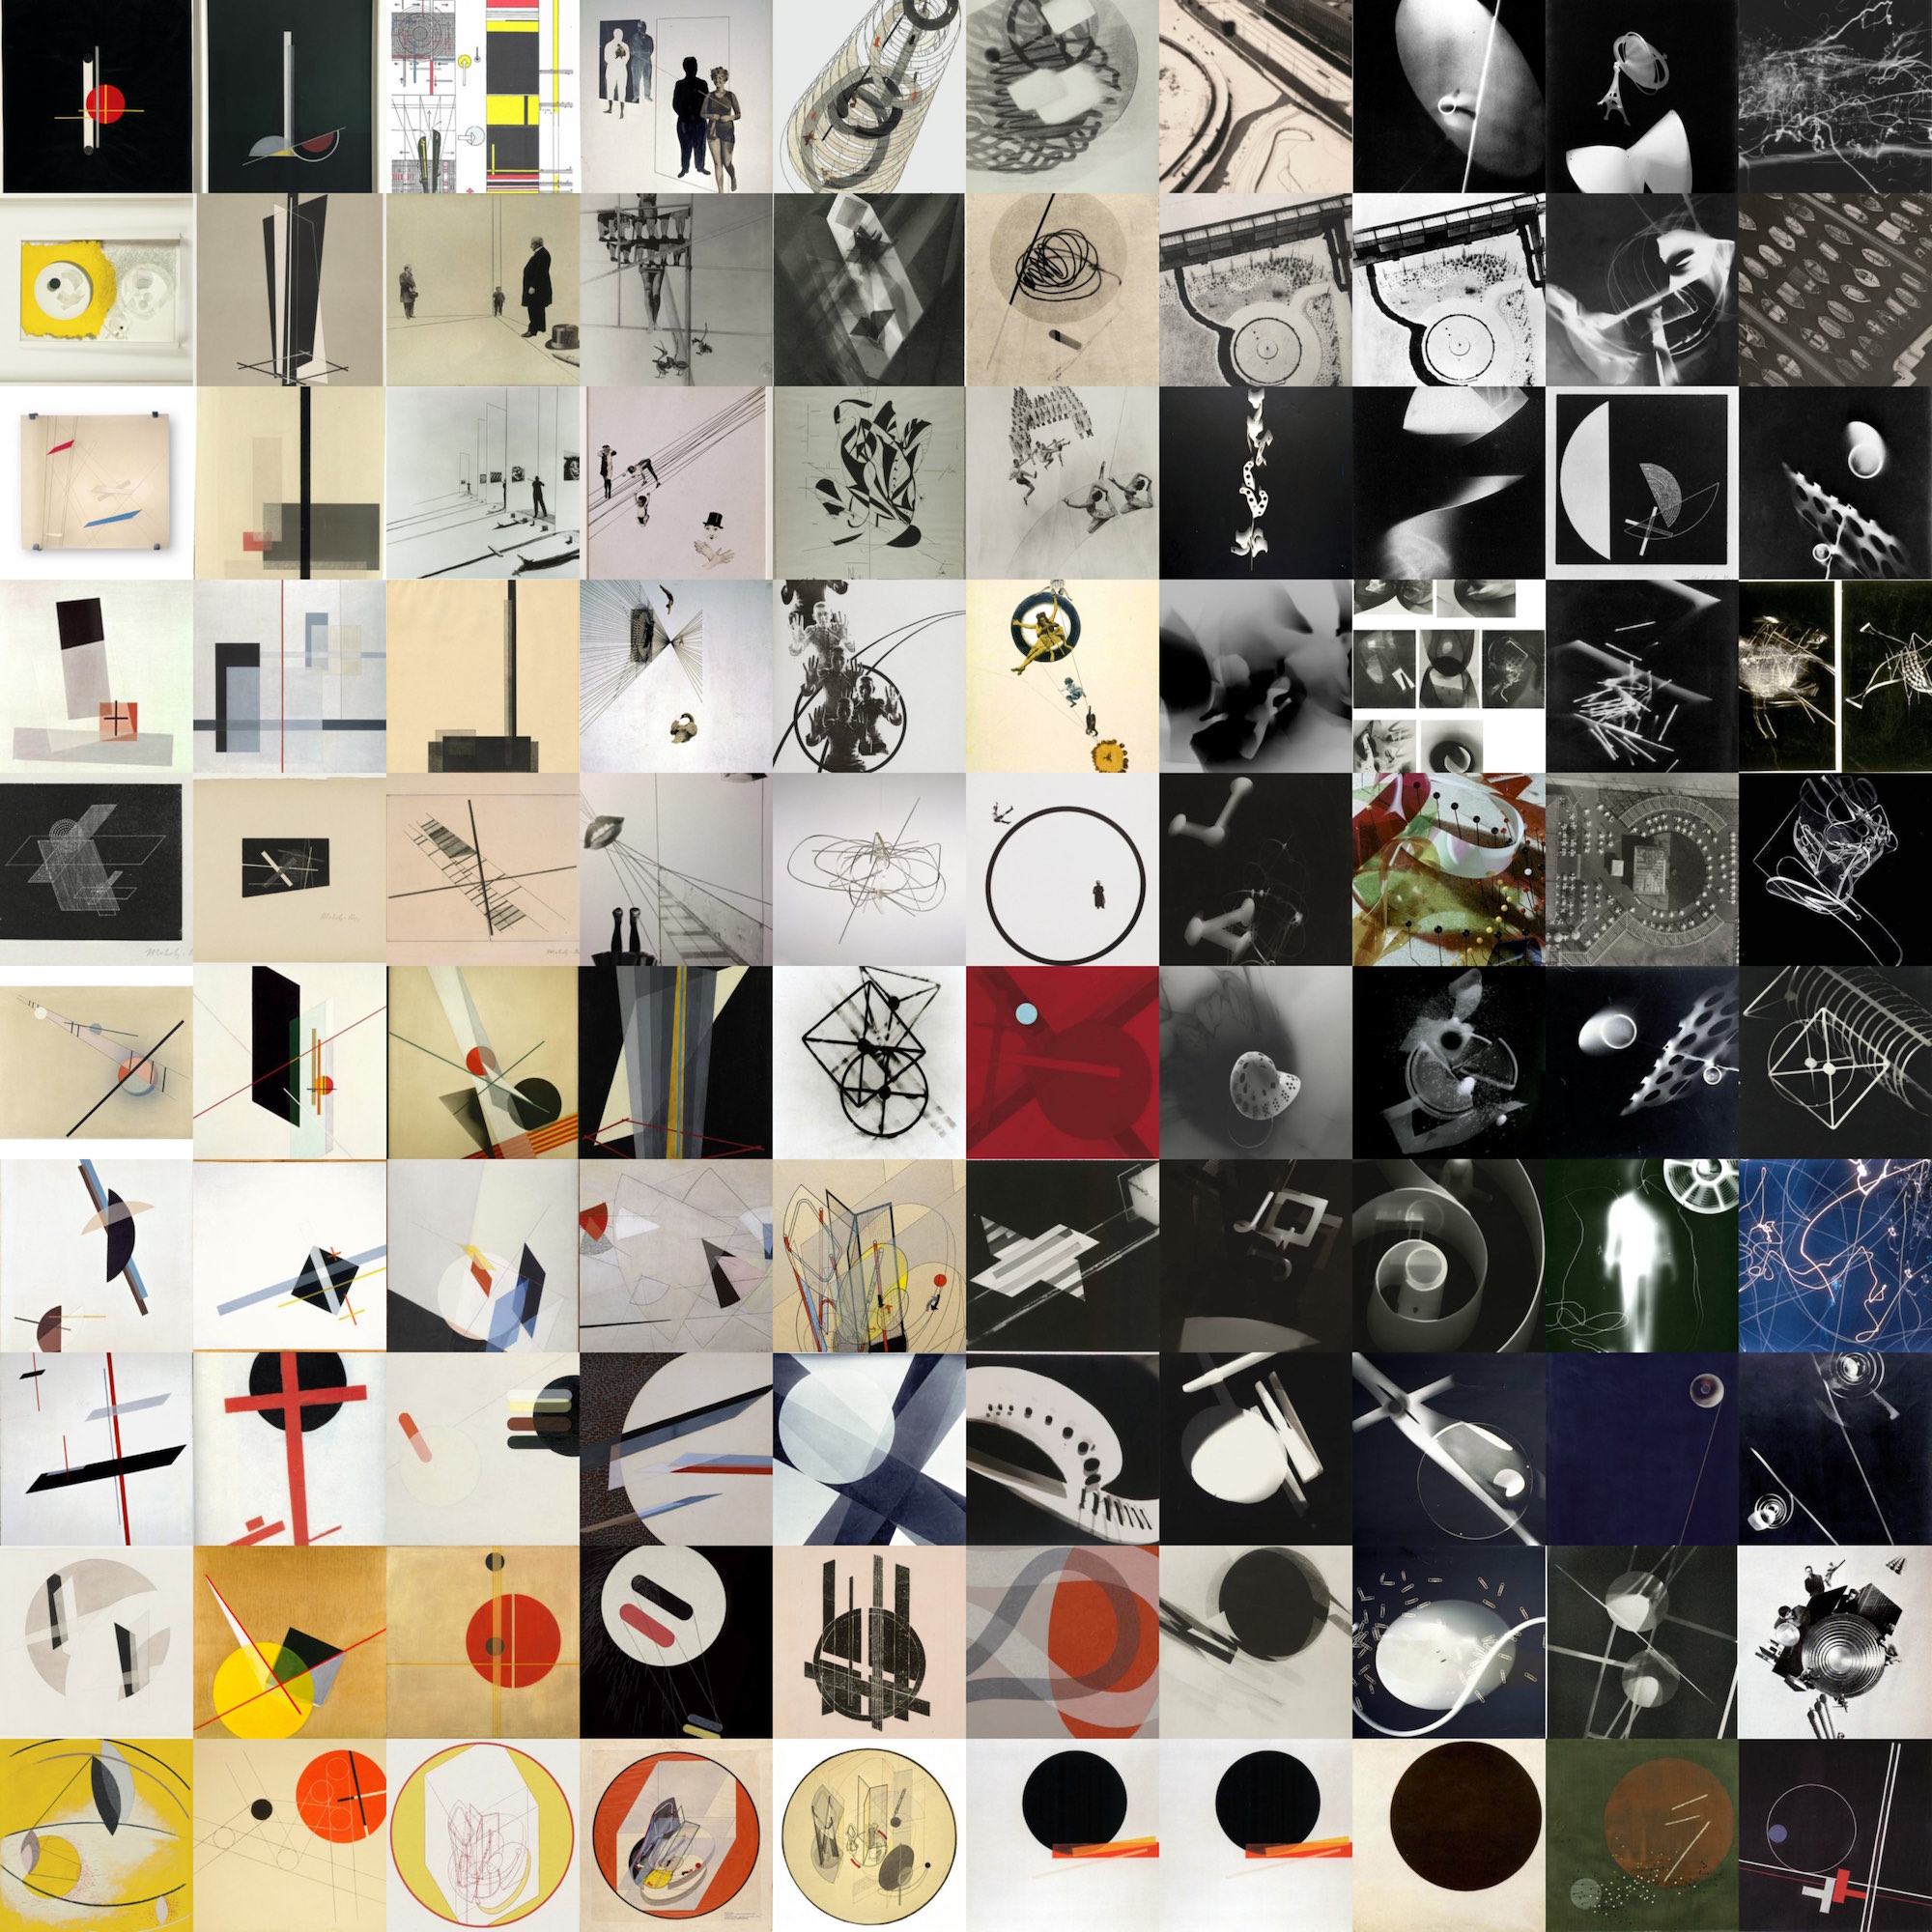
Such as the case with an ongoing project, where I was asked to create realtime visuals for an event, where the work should reflect on the works of László Moholy-Nagy. For investigating colors, shapes and methods that he was using, I reorganised my collected images according their visual similarities, so visual coherence became more evident between the many types of media he was using.
Another interesting situation is, when you have plenty of items that you would like to look at once. While working with Prezi Delight Research Lab, we have been asked to make visualization for a birthday event of the company. So we came up with the idea to collect all the thumbnails of Prezies people created and show their diversity and multicultural nature. Collecting, preparing that amount of data is an interesting challenge in itself, we had some engineering help in building the collection. We divided all the images into subcategories based on their creation time and arranged the items in the resulting groups based on their visual similarities. The result is giving a clear overview of the distribution of frequent colours, used templates, typography and shapes people were using the most often.
Such as images, there are other type of media collections, made of films, animations, interactive content, etc. Recently, media visualization became a great and inspiring field. Since I work with sonic interfaces and instruments a lot, I started experimenting with sounds within that context. A single sound recording can be turned into a collection of sound fragments using a few methods. I cut them apart based on onset events found in the original soundfile, then I tried to look at the resulting collections from different "angles".
On this video, the collections are represented in a 2D space, where the elements are aligned based on their temporal positions (where time passes by on the x axis) in the original sound file. Then they are slowly transforming into another space, where their positions are based on their sonic similarities. Their colours are references to their original positions. The chunks that are currently played back are highlighted with a small circle and a number that is their temporal index.
All the visualizations above are made with OpenFrameworks, sound segmentation is made with Pure Data, feature extraction (using MFCC) and similarity-based neighbouring (using t-SNE) is made with Python, based on the extremely helpful repositories by Gene Kogan and others.